Building Mini-Kafka Phase 5: How I eliminated 655ms GC pauses in a Java storage engine — step by step with JFR proof
I built a distributed messaging system from scratch in Java 25. After getting the correctness story right — Raft consensus, binary TCP protocol, append-only log — I wanted to understand the actual performance characteristics. Not guess. Measure.
So I added JMH. And then I ran JFR. What I found surprised me.
The baseline
JMH SampleTime mode, 3 partitions, 16-byte messages, 1.5M samples:
p50: 3,900 ns p99: 6,500 ns p99.99: 306,000 ns p100: 40,000,000 ns That p100 — 40ms — was the first signal something was wrong. The second was JFR: GC evacuation pauses starting at 3ms and growing to 655ms over the benchmark run. Old gen growing without bound.

The diagnosis
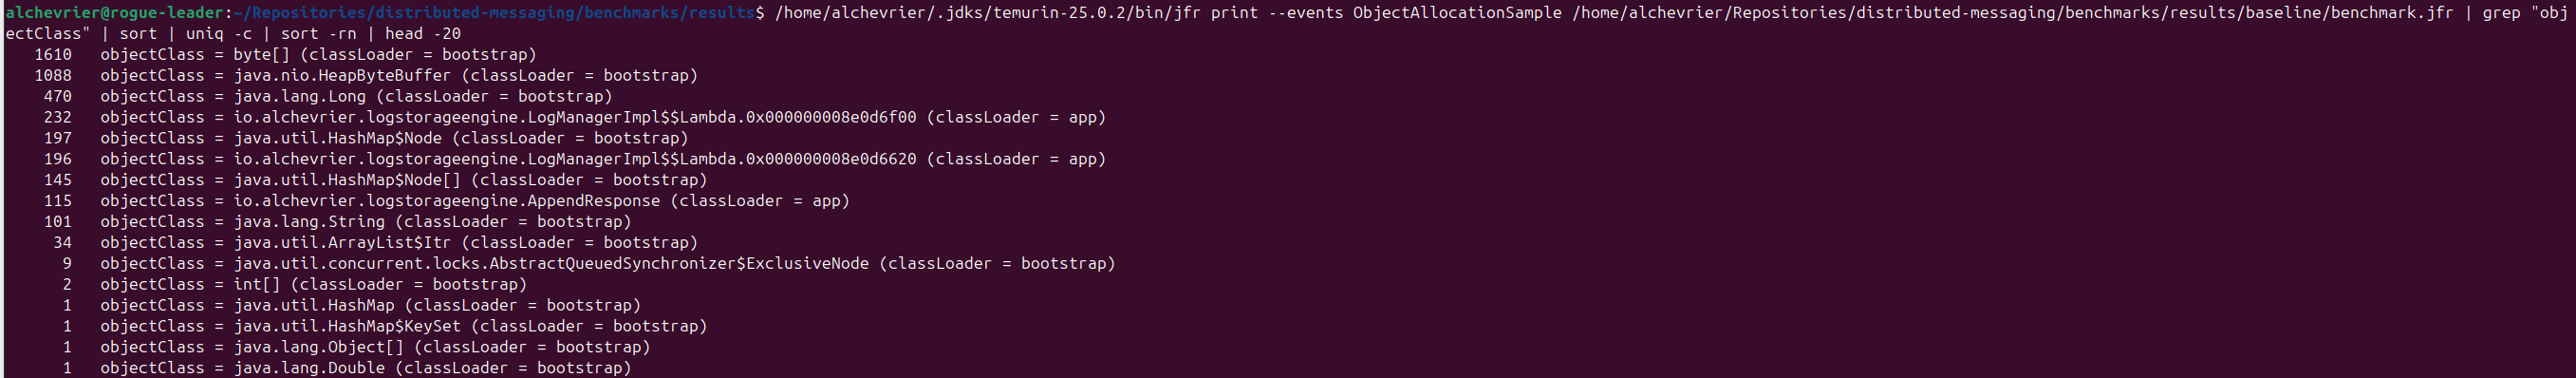
JFR’s allocation profiler pointed directly at two call sites in LogSegmentImpl.append():
ByteBuffer.allocate(4 + 8 + data.length) — a new buffer allocation per append, sized to the full record HashMap.put() — a new Map.Entry<Long, Long> per message indexed, both keys and values boxed At 1.5 million appends, that’s 1.5 million ByteBuffer objects and 1.5 million Map.Entry objects flowing through Eden into Old gen. The GC had no chance. JFR’s allocation sampler showed HeapByteBuffer, boxed Long, and HashMap$Node as the top three allocating classes — 1,800+ samples combined, all flowing into Old gen.
Step 1: MemorySegment header slab
Instead of allocating a new ByteBuffer per append, pre-allocate a 12-byte MemorySegment once at construction and reuse it for every header write. Use scatter-gather FileChannel.write(ByteBuffer[], 0, 2) — one syscall for header and payload.
Result: p99.99 345µs, p100 35ms, max GC pause 217ms — still growing, but slower. The Eden pressure eased.

Step 2: Flat MemorySegment index
The HashMap<Long, Long> was the real problem. Every entry boxes both key and value. Replaced it with a pre-allocated off-heap flat array: (maxSegmentSize / 12 + 1) * 16 bytes, laid out as [offset: 8 bytes][filePosition: 8 bytes] per record. Binary search on append order — offsets are monotonically increasing.
Result:
p99.99: 70,519 ns (−77%)
p100: 11,993,000 ns (−70%)
Max GC pause: 2ms flat, no growth

Old gen stable. The hypothesis was confirmed.
Step 3 + 4: The read path — a concurrency bug and one fewer syscall
Original read path: two FileChannel.read() calls — one for the 4-byte length header, one for the data. I pre-allocated a shared ByteBuffer for the length read to avoid per-call allocation.
Then I noticed LogImpl uses a ReentrantReadWriteLock — multiple virtual threads can hold the read lock simultaneously. Two concurrent readers would race on that shared buffer: one thread’s clear() stomping on another’s flip(). A BufferUnderflowException waiting to happen under load.
The fix made both problems disappear: read the entire record — header + payload — in a single FileChannel.read() into the caller’s buffer. Extract the int length with getInt(), skip the 8-byte offset field with position(position() + 8), and the remaining bytes are the payload. Zero allocation. Thread-safe because the buffer is caller-owned.
Also eliminated String concatenation on every read (topic.name() + “-“ + partition) by pre-computing routing keys at topic creation.
Result:
p50: 465 ns (−42% from read baseline)
p99: 734 ns (−34%)
p100: 718,848 ns (−42%)
Max GC pause: 2ms flat

The lesson
The fix I thought I needed (pre-allocating the length buffer) introduced a concurrency bug. JFR told me where the actual problem was. The right fix was structurally different from what I assumed.
Measure first. JFR is free. The allocation flamegraph will tell you more than any intuition will.
Full source: github.com/alchevrier/distributed-messaging